Education
An Early Look at the Pandemic’s Consequences for North Carolina Schools
Thurston Domina, Caitlin Kearney, Ayesha Hashim, Dana Griffin, Cole Smith
January 26, 2022
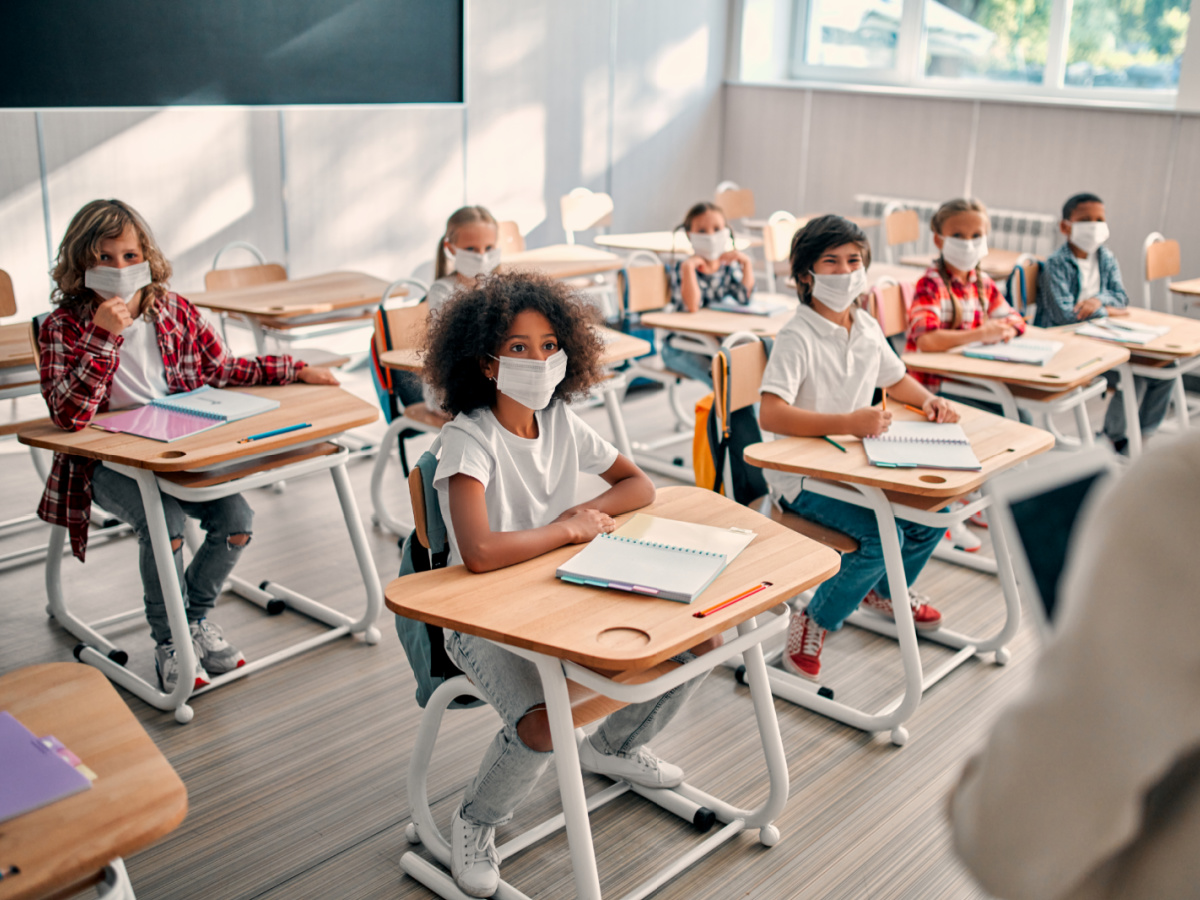
The COVID-19 pandemic has created unprecedented challenges for young people in North Carolina and around the world; subjecting youth to health risks, emotional trauma, economic insecurity. At the same time, the pandemic disrupted schooling. Schools closed their doors in Spring 2020 and embarked on a months-long effort to provide remote education for homebound youth. These disruptions continued into the 2020-21 school year, as schools struggled to establish new routines that addressed urgent community needs and facilitated learning while protecting student health.
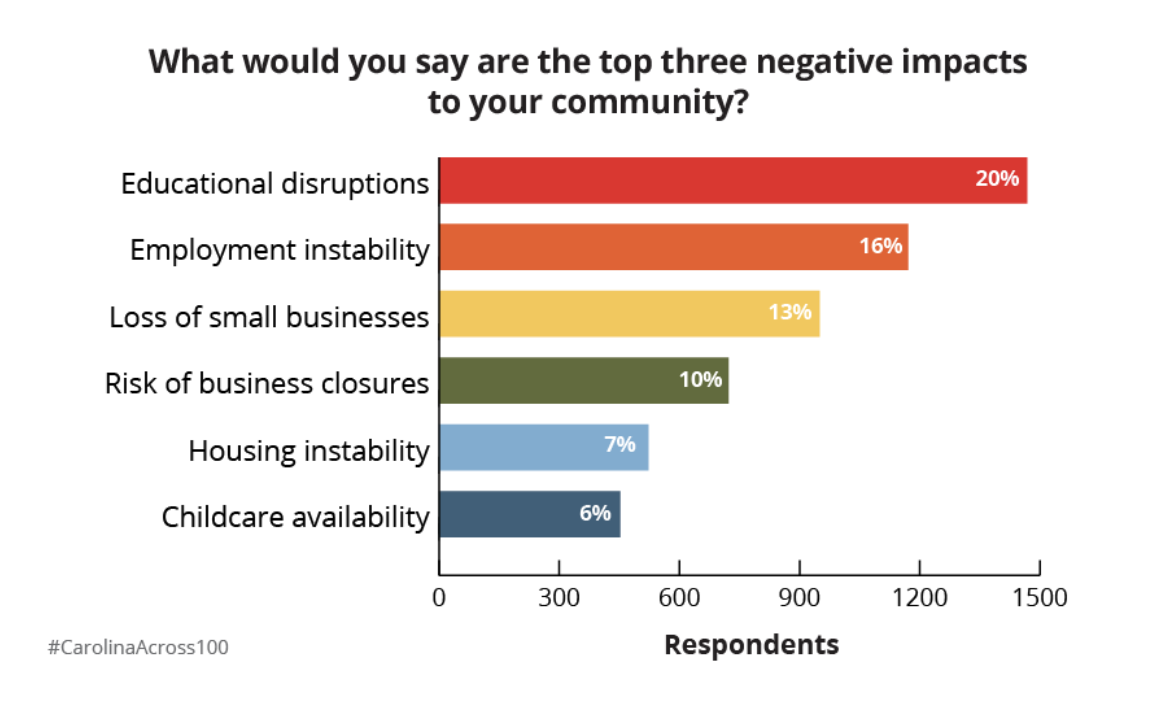
According to data from the Carolina Across 100 survey, educational disruption was a top concern among respondents. Individuals identified education as being significantly impacted by the pandemic as well as being an area where significant, long-term negative effects are expected. This finding was remarkably consistent across counties, despite potential differences in school districts and related factors, such as access to broadband services for virtual learning. Additionally, Carolina Across 100 data collected through in-depth interviews echoed these concerns. An interview respondent from Guilford County described COVID-19 as a “gut punch,” particularly for schools that were already struggling to address student achievement gaps.
Today, the vast majority of North Carolina’s K-12 students are, once again, learning together in school buildings. But things have, by no means, gone back to “normal.” The pandemic has fundamentally changed the state’s schools and its students.
Slowed Academic Achievement
COVID-19 disrupted learning trajectories for students across the U.S. While many use the phrase “learning loss” to describe these disruptions, we think this phrase is inaccurate. Data from tests administered to approximately 5.5 million third grade through eighth-grade students in schools and districts across the United States throughout the pandemic, indicate that students across the country continued to make achievement gains throughout this difficult period. But the pandemic clearly slowed student achievement growth rates, particularly in mathematics. While these data – which are only available for the subset of students whose schools administered NWEA’s MAP Growth assessment — suggests that the pandemic slowed achievement growth for students in all ethnic groups; the disruptions appear to be particularly pronounced for American Indian and Alaska Native, Black, and Latinx students as well as students in high-poverty schools. They also appear to be more pronounced in mathematics than in reading.
Preliminary data point to similar learning disruptions in North Carolina public schools. Statewide, 65 percent of North Carolina third-graders reached their grade-level proficiency benchmark in mathematics in 2019. But in 2021, after more than a year of pandemic-induced disruptions, just 44 percent of tested third graders in North Carolina public schools reached the proficient benchmark in mathematics. While the pandemic also disrupted student progress in reaching, this disruption appears to be somewhat less pronounced. Third-grade proficiency rates in North Carolina public schools fell from 57 percent in 2019 to 46 percent in 2021.
District Variations
In the graph below, we investigate the extent to which these disruptions vary across the state’s public school districts. Each dot on these figures represents a district and districts with larger enrollments are represented with proportionately larger dots. In the left graph, each of the state’s districts line up on the diagonal red line because their third graders’ math performance in 2018 was nearly identical to their third graders’ math performance in 2019. In other words, district performance in 2018 was an almost perfect predictor of performance in 2019. But the pandemic interrupted that stability. As the graph on the right illustrates, nearly every district in the state reported substantially lower third-grade math proficiency rates in 2021 than they did in 2019. As we look more closely at these data, we are struck by how broad-based these disruptions to math achievement were. The pandemic hurt math achievement for third graders in districts across the state – in big cities and small towns, from the mountains to the sea.
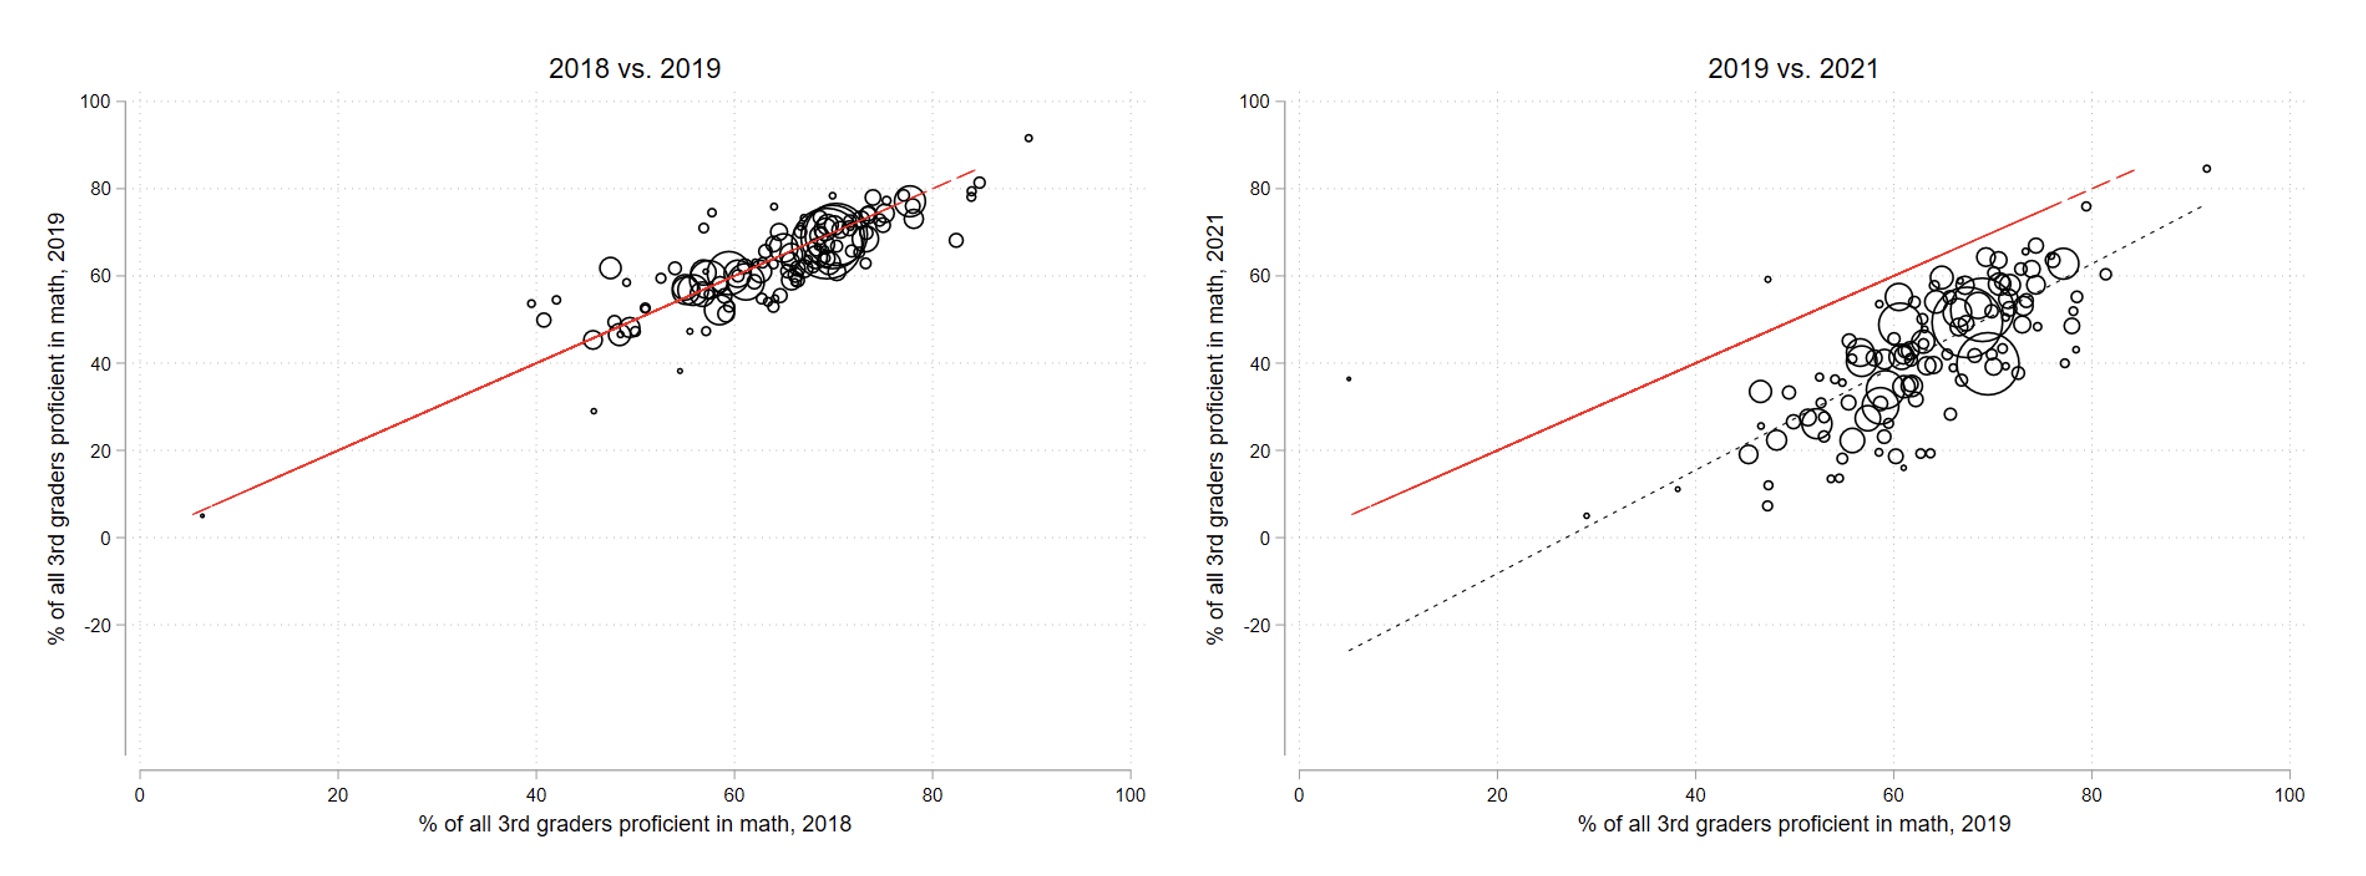
Mathematics proficiency rates for third graders in North Carolina public school districts, 2017-18, 2018-19, and 2020-21 academic year. Data drawn from end-of-grade tests administered by the NC Department of Public Instruction.
It is important to note that these data are imperfect. While nearly all third graders in North Carolina public schools took the tests upon which these graphs are based in 2018 and 2019, less than 10 percent of third-graders opted not to come into their school buildings and take the tests – which were not administered remotely – in 2021. Furthermore, these test data only capture one aspect of student development and provide limited insight into the lived experiences of students and educators during the pandemic. Students across the state likely both suffered harms and gained strengths during these difficult years that these tests cannot measure.
Next Steps to Recovery
Moving forward, our research team hopes to shed light on the communities, schools, and students that the pandemic impacted most acutely. We are also reaching out to district stakeholders across the state to learn about how educational leaders navigated the pandemic and how they are working to help educators and students recover from this deeply traumatic period. We welcome the opportunity to speak with district stakeholders who want to connect with us.
UNC-Chapel Hill’s Carolina Across 100 initiative is a 5-year program charged by Chancellor Kevin Guskiewicz which will partner with communities in all 100 North Carolina Counties to aid in pandemic recovery and help build resiliency. Stay connected with Carolina Across 100 as we continue to share data and resources.